MT4 Indicators

The world’s most popular trading platform – MetaTrader 4 – has a comprehensive range of indicators to take your trading to the next level, wherever you are on your journey.
Orders indicator
The Orders Indicator allows you to monitor your own trades and analyse other traders’ activity. It shows your trades on the chart, pin pointing where a trade was opened and closed, and whether you made a profit or loss (shown in currency & in pips).
Pip value calculator
Find out what the value of a 1 pip/point move is on any instrument in the base currency of your trading account and work out your risk to reward ratio. You can also use the indicator formula to manage your funds and create your own EAs.
Pivots SR Levels
View daily, weekly and monthly pivot points and the corresponding support and resistance levels at a glance. The Pivot SR Levels indicator can be used as a breakout strategy and is really useful for when you want to set Stop Losses.
Spread indicator
View the current spread value in pips on the chart for the needed timeframes with this helpful and adjustable Spread Indicator.
Market Data to CSV
Automatically record all historical bar data on your chart and every new tick to a csv file. To find your saved file, open the «MQL4» folder in the MetaTrader 4 directory and click on the «Files» folder.
Day Bar Info indicator
The real-time Day Bar Info Indicator displays quotes with 4 and 5 decimal places. It draws a daily candle on charts with timeframes up to D1 displays the size of upper and lower shadows, the body and the entire candle in points.
What are forex MT4 Indicators?
MetaTrader 4 indicators are technical analysis tools that can help to identify market trends and give you an indication about future price movements.
While mostly popular for forex trading, MT4 indicators can also be used to assist in trading other CFD products.
These free tools are a great way to customise your trading and develop your own unique skills and strategies.
How to use MT4 indicators
Register or log in to MyFXTM.
Choose your MT4 indicator and download it.
Experiment and get the latest market insights.
Develop your own strategy according to your risk profile and trading style.
Discover fresh trading opportunities!
Register or log in to MyFXTM.
Choose your MT4 indicator and download it.
Experiment and get the latest market insights.
Develop your own strategy according to your risk profile and trading style.
Discover fresh trading opportunities!
Previous Next
More tools to guide you on your trading journey
Combine the power of FXTM with free MT4 indicators.
It takes just minutes to create an account.
Our Customer Support team are here to guide you, so feel free to reach out.
Raise Request
Help Centre
FREQUENTLY ASKED QUESTIONS
What is the best indicator for MT4?
A lot will depend on your own unique trading style and financial goals, as indicators on MT4 serve a range of different purposes. There are over 30 to choose from, but some of the most popular include MACD, Stochastic, Relative Strength Index (RSI) and Bollinger Bands.
Which indicator is best for Forex?
This also depends on your trading strategy, but one of the most popular for FX traders is the Relative Strength Index (RSI). RSI highlights a temporary oversold or overbought condition in the market. An RSI value of over 70 represents an overbought market, and a value below 30 suggests an oversold market.
Where are the indicators in MT4?
Start by opening your MT4 platform. Click on the Navigator window at the top left-hand side of your screen and open the folder labelled Indicators. Choose the indicator you’d like to use and drag it on to your price chart. A small window will pop up in front of you where you can set your chosen limits and start using your indicator.
How do I know when to buy or sell in forex?
We don’t mean to repeat ourselves here – but this also depends on your trading strategy. In the main, traders tend to follow the principle that the best time to trade is when the market is active or even volatile. Liquidity is an important factor too. It also helps to keep a close eye on the latest price trends, as a sudden hike or drop or prices could offer potential profit opportunities for traders on the ball.
Join our community
- Licensed Broker
- Privacy Statement
- Cookie Policy
- Risk Disclosure
- Terms and Conditions
+44 20 3734 1025
Exinity Limited:
Exinity Limited, 5th Floor, 355 NEX Tower, Rue du Savoir, Cybercity, Ebene 72201, Mauritius
Exinity Capital East Africa Ltd:
West End Towers, Waiyaki Way, 6th Floor, P.O. Box 1896-00606, Nairobi, Republic of Kenya
- Accounts Overview & Comparison
- Advantage Account
- Demo Trading
- Performance Statistics
- Commissions and Fees
- Deposits and Withdrawals
FXTM brand is authorized and regulated in various jurisdictions.
ForexTime Ltd (www.forextime.com/eu) with registration number HE 310361 and registration address at 35, Lamprou Konstantara, FXTM Tower, 4156, Kato Polemidia, Limassol, Cyprus is regulated by the Cyprus Securities and Exchange Commission with CIF license number 185/12.
Exinity Capital East Africa Ltd (www.forextime.com) with registration number PVT-ZQU6JE7 and registration address at West End Towers, Waiyaki Way, 6th Floor , P.O. Box 1896-00606, Nairobi, Republic of Kenya is regulated by the Capital Markets Authority of the Republic of Kenya with a Non-Dealing Online Foreign Exchange Broker with license number 135.
Exinity UK Limited (www.forextime.com/uk) with registration number 10599136 and registration address at 1 st. Katharine’s Way London, England, E1W 1UN, UK is authorised and regulated by the Financial Conduct Authority with license number 777911.
Exinity Limited (www.forextime.com) with registration number C119470 C1/GBL and registration address at 5th Floor, NEX Tower, Rue du Savoir, Cybercity, 72201 Ebene, Republic of Mauritius is regulated by the Financial Services Commission of the Republic of Mauritius with an Investment Dealer License with license number C113012295, licensed by the Financial Sector Conduct Authority (FSCA) of South Africa, with FSP No. 50320 and is a licensed Over the Counter Derivative Provider.
Card transactions are processed by Exinity Works (CY) Limited, registered number HE 351684, and registered/business address at Exinity Tower, 35 Lamprou Konstantara, Kato Polemidia, Limassol, 4156, Cyprus. Address for cardholder correspondence: backoffice@fxtm.com.
Risk Warning: Online Forex/CFDs are complex instruments and come with a high risk of losing money rapidly due to leverage. 81% of retail investor accounts lose money when trading Online Forex/CFDs with this provider. You should consider whether you understand how CFDs work and whether you can afford to take the high risk of losing your money. It is the responsibility of the Client to ascertain whether he/she is permitted to use the services of Exinity Capital East Africa Ltd based on the legal requirements in his/her country of residence. Please read FXTM’s full Risk Disclosure.
Regional restrictions FXTM brand does not provide services to residents of the USA, Mauritius, Japan, Canada, Haiti, Iran, Suriname, the Democratic People’s Republic of Korea, Puerto Rico, the Occupied Area of Cyprus, Quebec, Iraq, Syria, Cuba, Belarus and Myanmar. Find out more in the Regulations section of our FAQs.
© 2011 — 2023 FXTM
Risk warning: Trading is risky. Your capital is at risk.
Online Forex/CFDs are complex instruments and come with a high risk of losing money rapidly due to leverage. 81% of retail investor accounts lose money when trading Online Forex/CFDs with this provider. You should consider whether you understand how CFDs work and whether you can afford to take the high risk of losing your money.
FXSSI. CurrentRatio
![]()
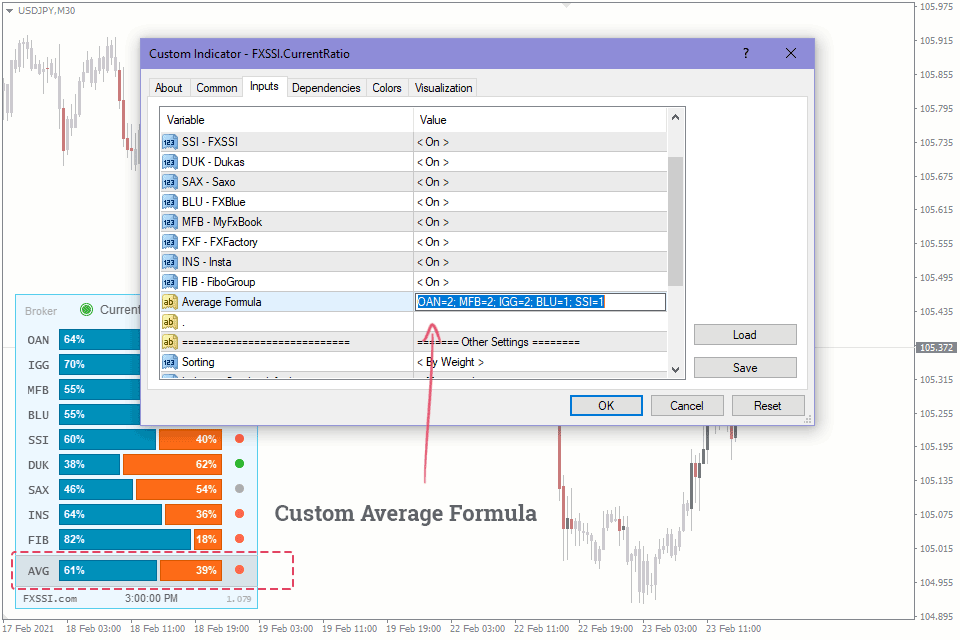
You can enter a custom formula for the average value specifying a different weight for each source.
FXSSI.CurrentRatio Screenshots (8)
How to Install
Reviews (42)
FXSSI.CurrentRatio — Overview
When talking about trading “against the crowd” or trading on sentiment, what we mean is the analysis with the buyer/seller ratio, also know as SSI (Speculative Sentiment Index).
It is the most easy-to-use and intuitive indicator for a novice trader and probably the most popular one for the same reason.
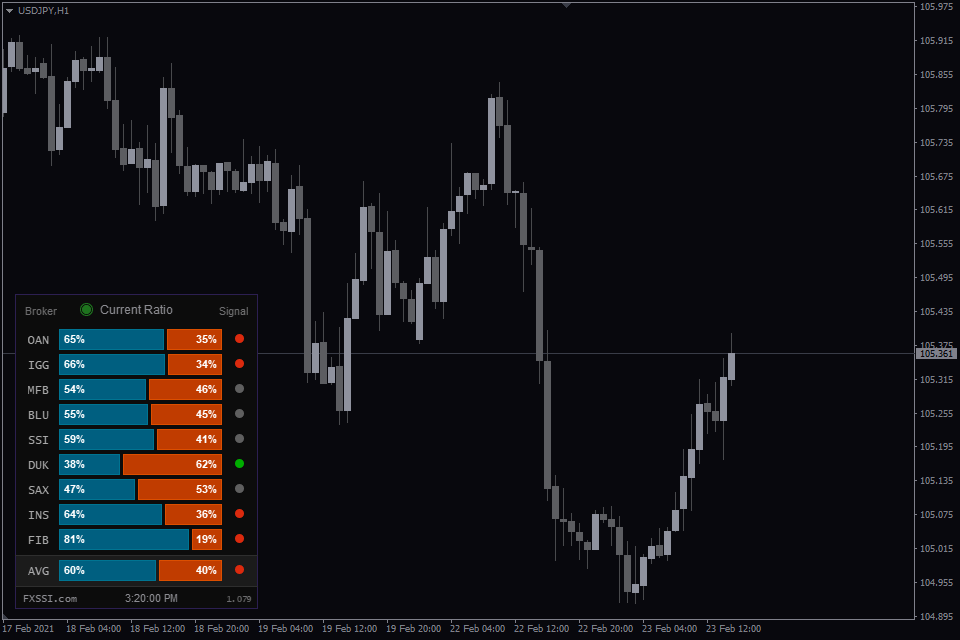
Current Ratio Indicator
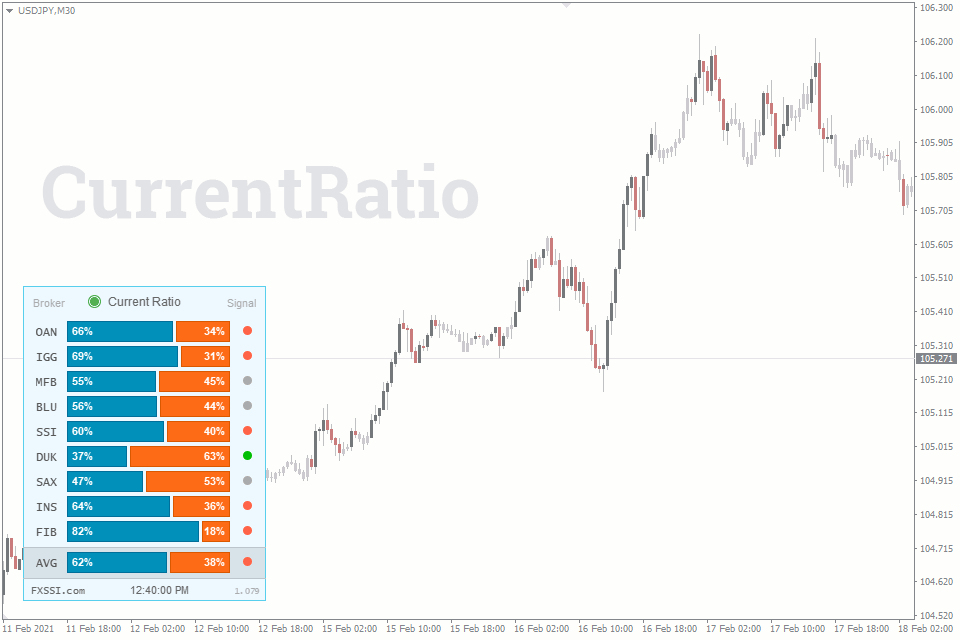
The Current Ratio indicator shows the ratio between buyers and sellers currently being in the market. The ratio data comes from several major brokerage companies and some services, such as ForexFactory.
To display the open position rate as a chart, you need a separate FXSSI.Ratios indicator.
The indicator takes into account only currently open trades, while the closed ones don’t affect it.
The given indicator provides data on the long vs short ratio (i.e., client positioning) from 10 sources for 12 Forex pairs (these figures may change over time). Today, there are numerous sources of the ratio of positions, but we use only the most relevant of them in our indicators and tools.
The indicator is used for:
- Medium-term trading;
- Determining a trade direction;
- A quick assessment of a trend state.
The Current Ratio indicator is not resource-intensive and is rather compact, making it almost a must-have tool in the arsenal of every trader regardless of the strategy being applied.
Why Is It Important to Analyze the Long/Short Ratio?
According to a popular belief, about 95-99% of traders lose their money in the market, i.e., they trade at a loss. Therefore, trading in the opposite direction from most traders can be profitable.
This indicator was developed specifically for such a quick assessment of the current sentiment of most traders.

The image above shows the easiest analysis method using this indicator. The blue bar represents the percentage of buyers, while the orange one reflects the percentage of sellers.
If most traders go long, you should look for a short position. If most of them expect an asset to drop in price, you should consider a long position.
Trading With the Indicator
The basic idea of how the indicator works is not to open a trade in the same direction as most traders in the market do.
By following this simple principle, you’ll increase your chances of making a successful trade.
Besides, when you trade against the market majority, you trade with a trend, since most of the trades are always open against the trend.
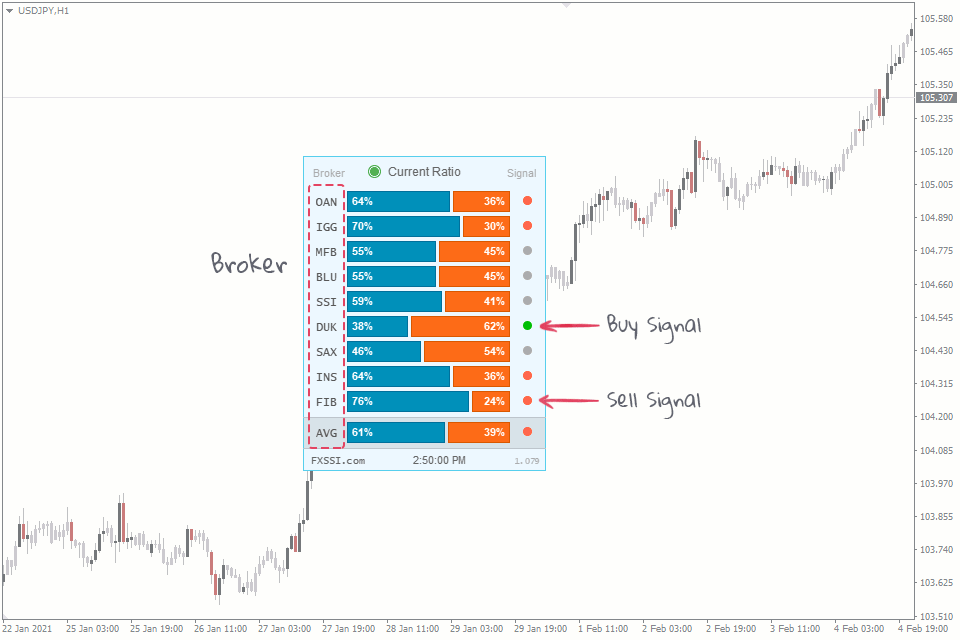
Buy Signal

You may go long when:
- Most sources signal Buy (green circle);
- The signals are distributed equally;
- All the sources don’t give any signals (gray circle).
Sell Signal

You may go short when:
- Most sources signal Sell (red circle);
- The signals are distributed equally;
- All the sources don’t give any signals (gray circle).
As you can see, the main idea is not to open a trade in the same direction as most retail traders do; however, if there is no such a majority, you can open a trade in any direction.
To increase the win-rate of signals, you can develop your own strategies using this indicator. For example: “Open a trade only when three or more sources give you a Buy signal, while none of them shows a reverse signal.”
Indicator Features
Some of the indicator features:
Signal “lights”. The given feature allows you to interpret the indicator readings quicker. This is because we perceive and convert colors into information much faster than numbers.

You can specify the conditions for the signal to appear in the indicator settings on your own. For example, if the value is 40% or less, the signal will be green; if the value is 60% or more, it will be red. Gray color represents a neutral signal that occurs when the indicator value ranges from 40% to 60%.

The custom formula for AVG (average value) – enter your own formula for calculating the average buy/sell ratio value.Input format: OAN = 2; MFB = 2; IGG = 2; BLU = 1; SSI = 1, where
- «MFB» – three-character code of the source;
- «2» – the share of the source in the average value.
You can add or remove sources from the formula, as well as specify any weight coefficient.
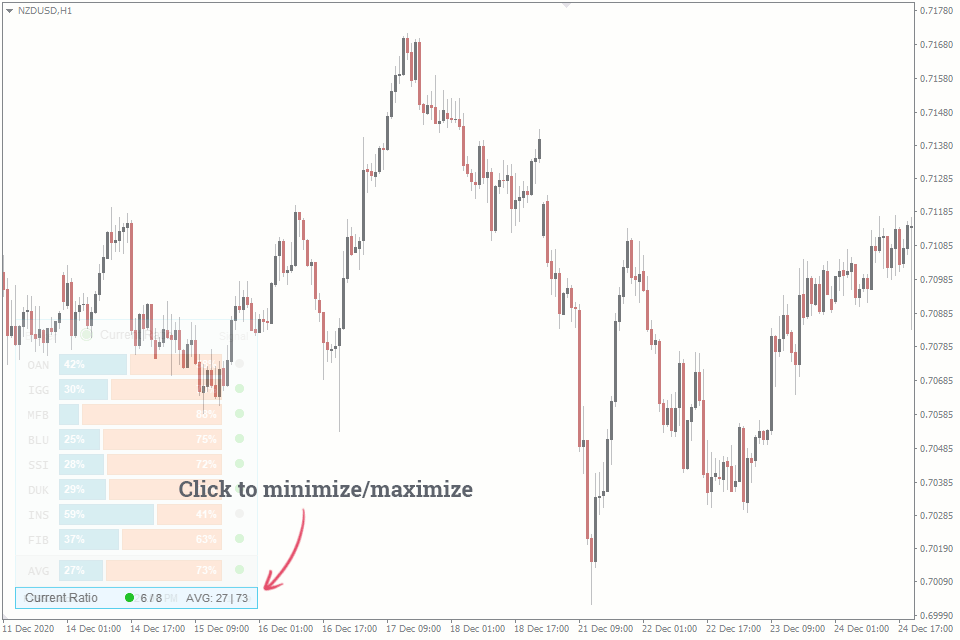
Minimizing. You can minimize the indicator panel by clicking on it or set minimizing as default.
When minimized, the indicator is still informative, since it indicates the direction of the maximum number of signals.
Let’s consider the example above. When maximized, we can see 3 Sell signals and 1 Buy signal. When minimized, we see the number “3” and the red “light”.
If we have 1 Sell signal and 1 Buy signal, the one which value is furthest from 50%, will be displayed.
Auto settings. The indicator is equipped with a feature of automatic detection of color scheme and time zone.
For your convenience, we have implemented the Automatic Indicator Update system. Now you just need to restart your terminal to get the latest version. The indicator will inform you about it in a separate window.
Indicator Settings

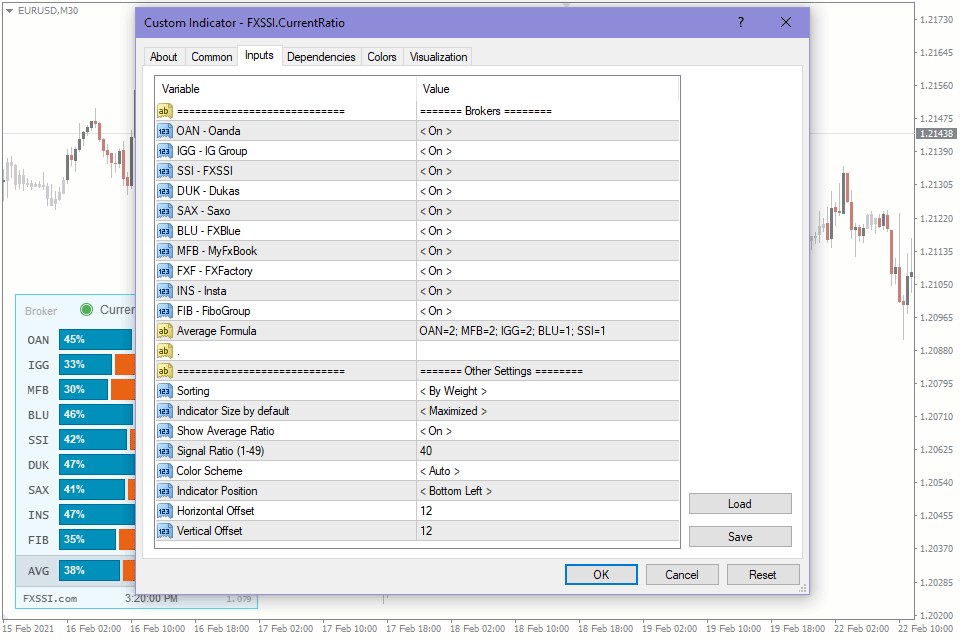
Brokers. Select those available brokers that should be displayed on the indicator panel (“On”) and those that you want to disable (“Off”).
Average Formula. Specify the brokers and their weight in the suggested format to include them in calculating the average value.
Sorting. Defines the order in which brokers are placed on the chart. There are three options to choose from:
- Alphabetically;
- By broker’s weight;
- In the descending order of values.
Indicator Size by default. Determines the state of the indicator panel (minimized/maximized) when you start your terminal or switch a timeframe.
Show Average Ratio. You can use this parameter to disable displaying the average value on the indicator panel.
Signal Ratio. Specify the SSI value, above which the indicator will signal the Buy or Sell. You can specify the values from 1 to 49. If 40 is set, the Buy signal will be generated when the long/short ratio is 40 or less, and the Sell signal will be generated when it is 60 or higher.
Color Scheme. By default, the indicator automatically detects the color scheme depending on the chart background. If necessary, select the desired color scheme from the list.
Indicator Position – selects the chart corner to place the indicator panel.
Vertical, Horizontal Offset – sets the offset (in pixels) from the selected chart corner.
Articles about FXSSI.CurrentRatio (2)
- How to Analyze the Crowd Behavior with Current Ratio Tool May 24, 2021
- 3 Strategies for Analyzing the Ratio of Open Positions Jan. 5, 2022
How to add FXSSI.CurrentRatio in MT4/MT5
The FXSSI.CurrentRatio indicator is part of the «FXSSI Pro» package, which also includes several other professional indicators.
Follow the instructions below to install the «FXSSI Pro» indicators package to your MT4 terminal:
- Download the ZIP-archive with «FXSSI Pro» indicators by clicking the link at the top of the page;
- Extract the contents of the archive (indicator files and DLL library) to the MQL4/5 folder of your terminal;
- If the system offers you the File Replacement, click – Yes;
- Restart the MT4/MT5 terminal;
- Run the indicator by double-clicking its name in the MT4 Navigator;
- Check the «Allow DLL imports» box and click «OK«;
- Go through the Authorization Procedure: click the «Authorize Link» that will appear after you first start the indicator, and sign in to your account;
- The indicator will be displayed on the chart;
- Adjust the indicator settings according to your needs: press CTRL+I, select the indicator from the list and switch to the «Inputs» tab.
If you have any difficulties while installing the indicator, please view the detailed instruction.
https://www.forextime.com/trading-tools/mt4-indicators